TMOG Task Manager OG Pro 1.0.1 由Windows任务管理器原作者Dave Plummer打造,基于C++20原生核心,无网页套壳,以12个专业维度实时监控进程与硬件瓶颈,精准定位卡顿发热耗电元凶。
原始标题:TMOG Task Manager OG Pro 1.0.1
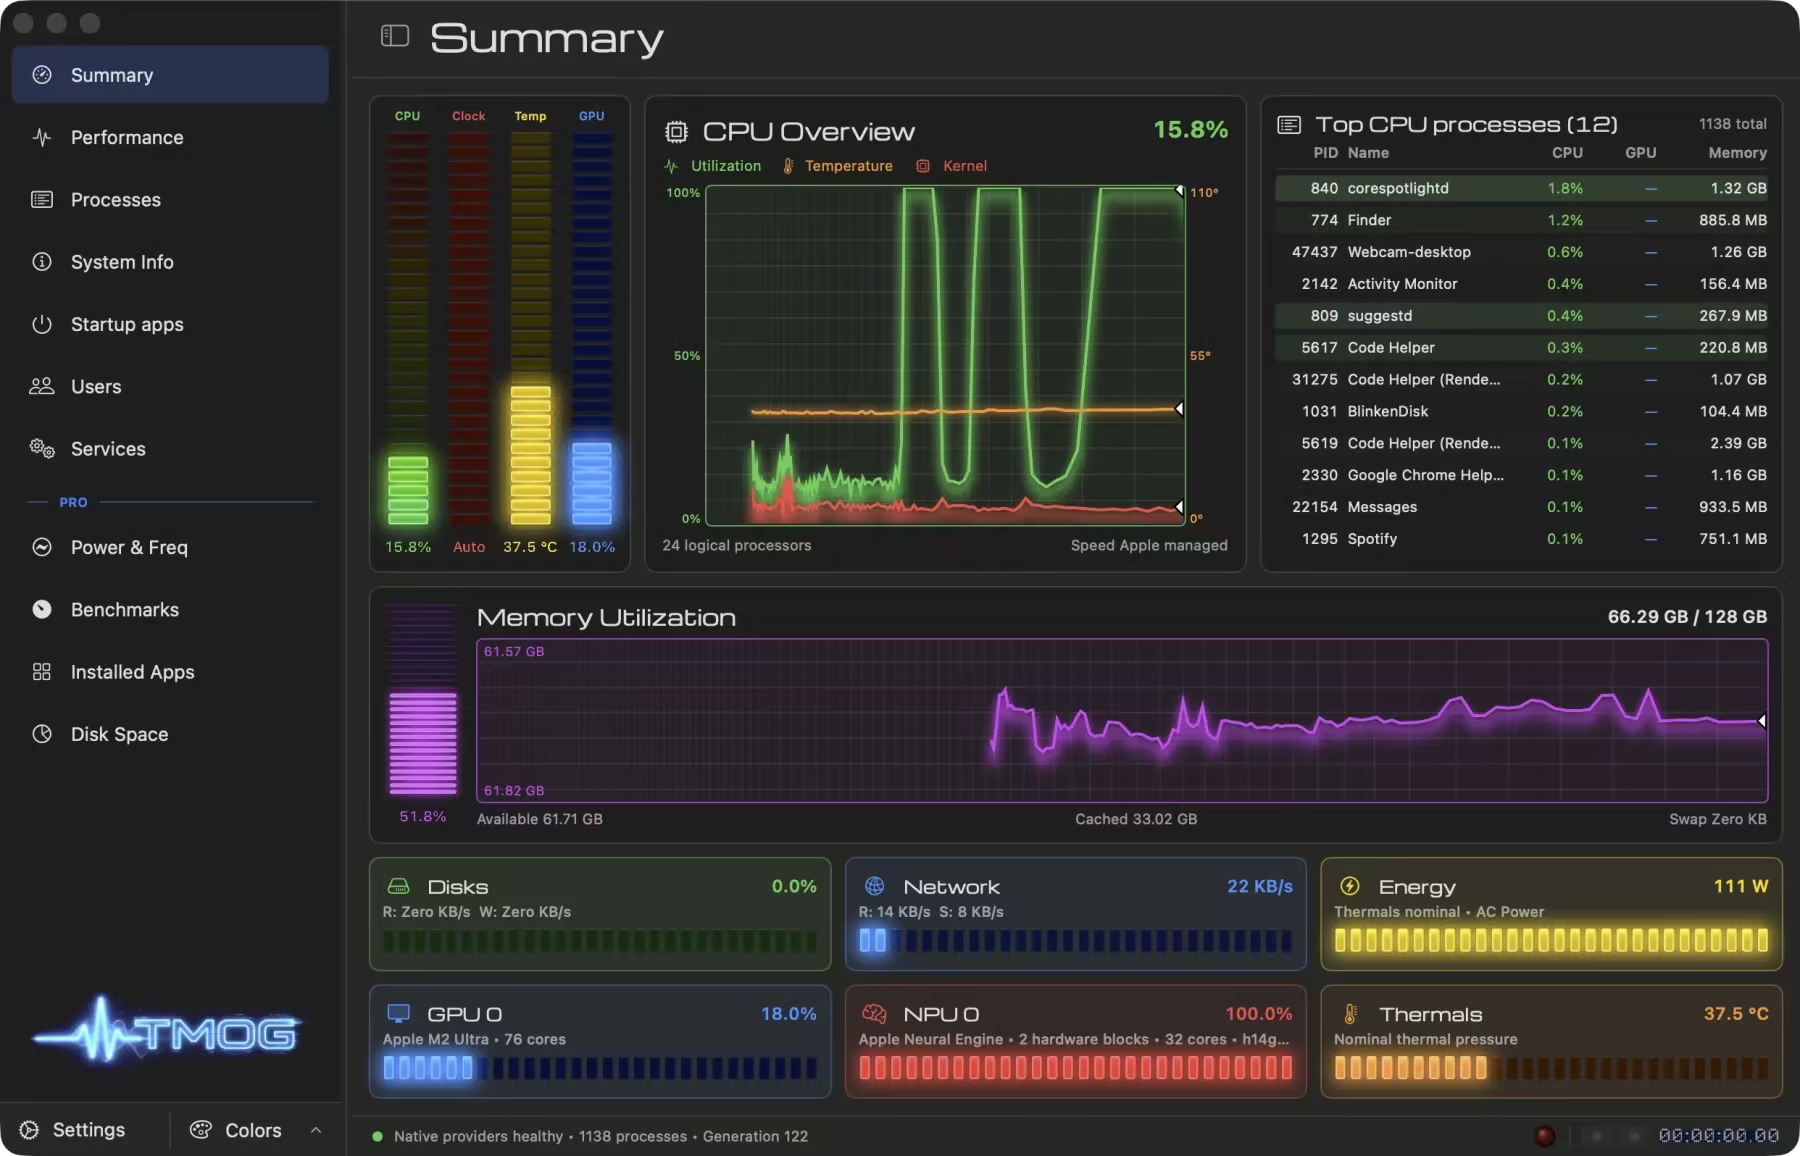
TMOG (Task Manager OG) 是一款由 Windows 任务管理器原作者戴夫·普拉默(Dave Plummer)倾力打造的全原生跨平台高级系统监视器。它拒绝任何网页套壳,底层基于统一的 C++20 核心,能够以极高的隐私标准、不加粉饰的绝对真实数据,在 12 个专业维度上实时、深度地帮助用户精准揪出导致电脑卡顿、发热或耗电的幕后进程与硬件瓶颈。
File size: 13.67 MB
Why is my Computer Slow? TMOG Knows Why! One glance at TMOG shows which process and which subsystem are responsible—right now. One measuring core. Three native applications. No browser shell.
Solved case 01 · The fan
Your computer’s fan just spun up. TMOG names the process before it spins down.
TMOG helps you connect the sound, heat, stutter, dropped frame, or drained battery to the process and subsystem that caused it.
– Sort and filter a live process hierarchy
– Compare CPU, memory, disk, network, and energy impact
– Follow identity-safe processes even when the system recycles a PID
Precision Instrumentation
A measuring instrument should never make up an answer. One glance at TMOG and you know why.
That promise rests on engineering rules you can verify yourself. TMOG distinguishes zero from unavailable and leaves gaps when samples stop. Every reading carries an explicit availability state, so a missing sensor cannot quietly become a plausible-looking value.
Here are the ten strongest facts behind the screen.
Native code all the way down.
TMOG uses Swift and AppKit on macOS, C++ and Win32 on Windows, and C++ with Qt 6 on Linux over one shared C++20 measuring core. No Electron, no web view, no embedded browser.
Twelve destinations, one glance apiece.
Summary, Performance, Processes, System Info, Startup apps, Users, Services, Power & Freq, Connections, Installed Apps, Disk Space, and Benchmarks.
Unsupported means unsupported.
TMOG never shows a zero it did not measure. Zero means the provider measured zero.
A stopped measurement leaves a gap.
A gap is the truth. Drawing a smooth line through missing samples would not be.
TMOG can measure itself, too.
Turn on the self-monitoring option to include TMOG’s own process and inspect the monitor’s cost.
Performance and efficiency cores stay distinct.
The CPU view color-codes them and can switch between overall, logical-processor, and NUMA views.
Replay the slow hour.
On macOS, Windows, and Linux, Flight Recorder records, saves, scrubs, and replays the same seven telemetry panels in one interchangeable .tmogtrace format. PRO
Energy has a cause.
The Energy view shows instantaneous watts, history, power state, and the processes responsible.
A PID is not enough.
TMOG pairs each PID with its creation identity so a recycled number cannot redirect an action to the wrong process.
Your machine stays your business.
TMOG sends no usage statistics, hardware inventory, process information, or identifiers. Its only routine request is an update check.
System Requirements: Windows 11
百度网盘下载: