
本课程将教你通过基准测试和代码剖析,定位并解决C#代码的性能瓶颈。涵盖热路径追踪、内存优化、缓存策略及算法复杂度分析,适合中级开发者提升应用运行效率。
原始标题:C# Benchmarking and Profiling
Released 9/2024
MP4 | Video: h264, 1280×720 | Audio: AAC, 44.1 KHz, 2 Ch
Level: Intermediate | Genre: eLearning | Language: English + subtitle | Duration: 2h 31m | Size: 1.1 GB
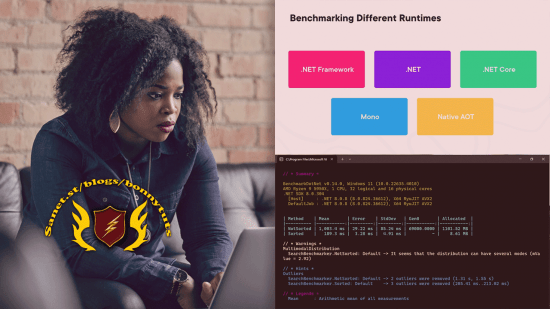
Learn how to beat performance issues by profiling and benchmarking your C# code.
Tired of performance issues and slow-running code? In this course, C# Benchmarking and Profiling, you’ll learn to track down hot code paths, understand why your code runs slower as the data set grows larger, and see how to avoid memory running out. First, you’ll explore how to begin profiling and benchmarking your code and understand why this work is important and what can happen if you ignore it. Next, you’ll discover how to handle the hot code paths, answering questions of what to do when memory runs out and what caching strategies are appropriate. Then, you’ll understand the importance of algorithmic complexity, giving you a great understanding of why code runs slower as the data set grows larger. Finally, you’ll learn the best practices for applying performance optimizations, refactor the hot code paths found during your profiling, and make the code run much faster. When you’re finished with this course, you’ll have the skills and knowledge of profiling and benchmarking your code needed to build powerful, real-world applications.
此处内容需要权限查看
会员免费查看