专为医学、公共卫生及生物科学领域学生与科研人员设计的R语言数据分析实操课,涵盖数据清洗、ggplot2图表绘制、gtsummary表格生成,深入教学线性、逻辑、泊松等回归模型,助力科研发表。
原始标题:Learn Data Science & Biostatistics with R and RStudio
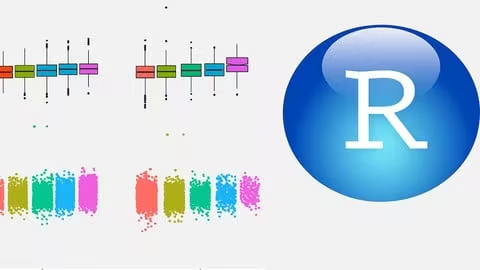
本课程是专为医学、公共卫生及生物科学领域的本硕博学生与科研人员量身打造的 R 语言数据分析实操课,旨在帮助学员攻克从真实世界健康数据集到 SCI 期刊发表级成果的完整全链路。课程紧贴临床与流行病学研究痛点,不仅涵盖数据清洗、ggplot2 出版级图表绘制、以及用 gtsummary 自动生成标准的学术三线表,更深入教学线性、逻辑、泊松及对数双比例(Log-Binomial)等核心医学回归模型,帮助你精准估计 OR 值与 RR 值。通过本课程的学习,即使你不是计算机背景,也能建立起规范、可重复的统计建模与 GIS 空间可视化思维,从而独立、自信地完成毕业论文或科研手稿中的数据分析工作。
MP4 | Video: h264, 1920×1080 | Audio: AAC, 44.1 KHz
Language: English | Size: 9.21 GB | Duration: 16h 52m
R programming and RStudio to analyze health data with regression, statistical modeling, GIS maps, and visualization
What you’ll learn
Apply ggplot2 to create professional, publication-quality graphs for biostatistical data
Use gtsummary to generate clear, formatted regression tables for research reporting
Perform and interpret Linear Regression for continuous outcomes
Conduct Logistic Regression to estimate odds ratios for binary outcomes
Apply Log-Binomial Regression to directly estimate risk ratios
Requirements
Basic understanding of R is recommended.
Familiarity with fundamental statistics concepts such as mean, median, proportion, and basic regression.
A computer with R and RStudio installed.
Willingness to learn intermediate-level data analysis, visualization, and regression techniques in R.
Description
Want to learn how to analyze real-world health or medical data using R and RStudio? This beginner-friendly course helps you master data science and biostatistics skills for research, thesis writing, and publications. Step by step, you’ll learn to clean data, run regressions, visualize results, and create publication-ready reports.
Learning R and RStudio can open doors to powerful data analysis, research, and publication opportunities — especially in public health and biostatistics.
This course is designed for students, researchers, and professionals who want to analyze health or biomedical data confidently and turn results into clear, professional reports.
You don’t need to be a coding expert. We’ll start from the basics and gradually move to real-world research examples.
What you’ll learn
Understand the basics of R programming and RStudio interface
Import, clean, and manage public health or clinical datasets
Perform descriptive statistics and data visualization using ggplot2
Build linear, logistic, Poisson, and log-binomial regression models
Use gtsummary to create publication-ready tables for manuscripts or theses
Interpret results and communicate findings clearly
Export clean, reproducible tables and graphs for academic writing
By the end of this course, you’ll feel confident using R to analyze your data, whether you’re working on a BSc, MSc, or PhD project, or preparing a manuscript for publication.
Who this course is for
BSc, MSc, or PhD students in public health, medicine, or biological sciences
Researchers and data analysts who work with health data
Anyone interested in learning biostatistics and R programming from scratch
此处内容需要权限查看
会员免费查看